Data
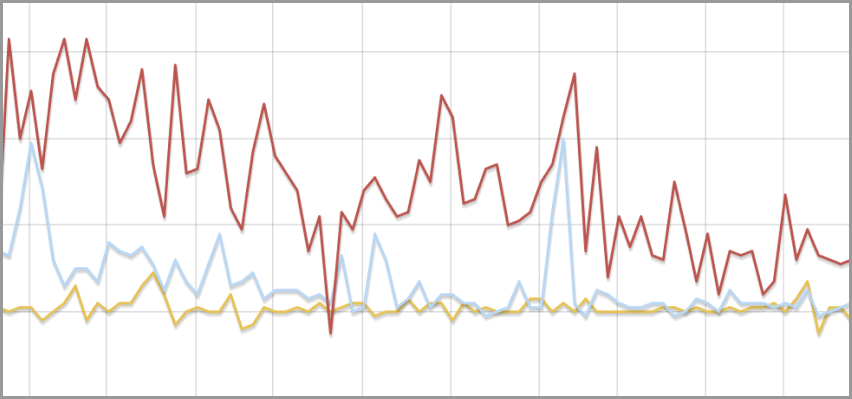
The dataset contains average hourly truck and auto volumes for one week. The data is based on traffic counts collected over a two week period during the Commercial Vehicle Survey (CVS).
Station ID:
Unique CVS station number
Station name:
Station name
Direction:
Direction of traffic
MTO region:
Five regions of MTO (Central, Eastern, etc)
Highway or road:
Highway number or road name
Location:
Description of location
Day of week number:
A number between 1 and 7 representing day of week. 1=Sunday, 7= Saturday
Hour:
Hour of day, 0 to 23 represents starting hour of the day (e.g. 12 represents
12 P.M. - 1 P.M.).
Single:
Number of single unit trucks
Multi:
Number of multi-unit trucks
Auto:
Number of cars and other passenger vehicles
Total trucks:
Sum of single and multi-unit vehicles
Total vehicles:
Number of total vehicles
[CVS]: Commercial Vehicle Survey [MTO]: Ministry of Transportation
Use the data API
Visualize data
Use the Data Visualizer below to display this dataset as a table, graph or map.

Report an issue with this data
Submit a report if you are experiencing issues with the data resources in this dataset.
Additional information
- Last updated
- April 30, 2015
- Created
- December 31, 2019
- Format
- text/csv
- File size
- unknown size
- Licence
- Open Government Licence – Ontario
- Type
- Data
- Language
- English
- Data range start
- January 1, 2005
- Data range end
- December 31, 2007
Help us improve the Data Catalogue
Provide feedback about our data and how you’re using it.